7QC Tools Consultant in Mumbai, India
5S six sigma refers to five Japanese terms for organizing and managing workspace and workflow. They are:
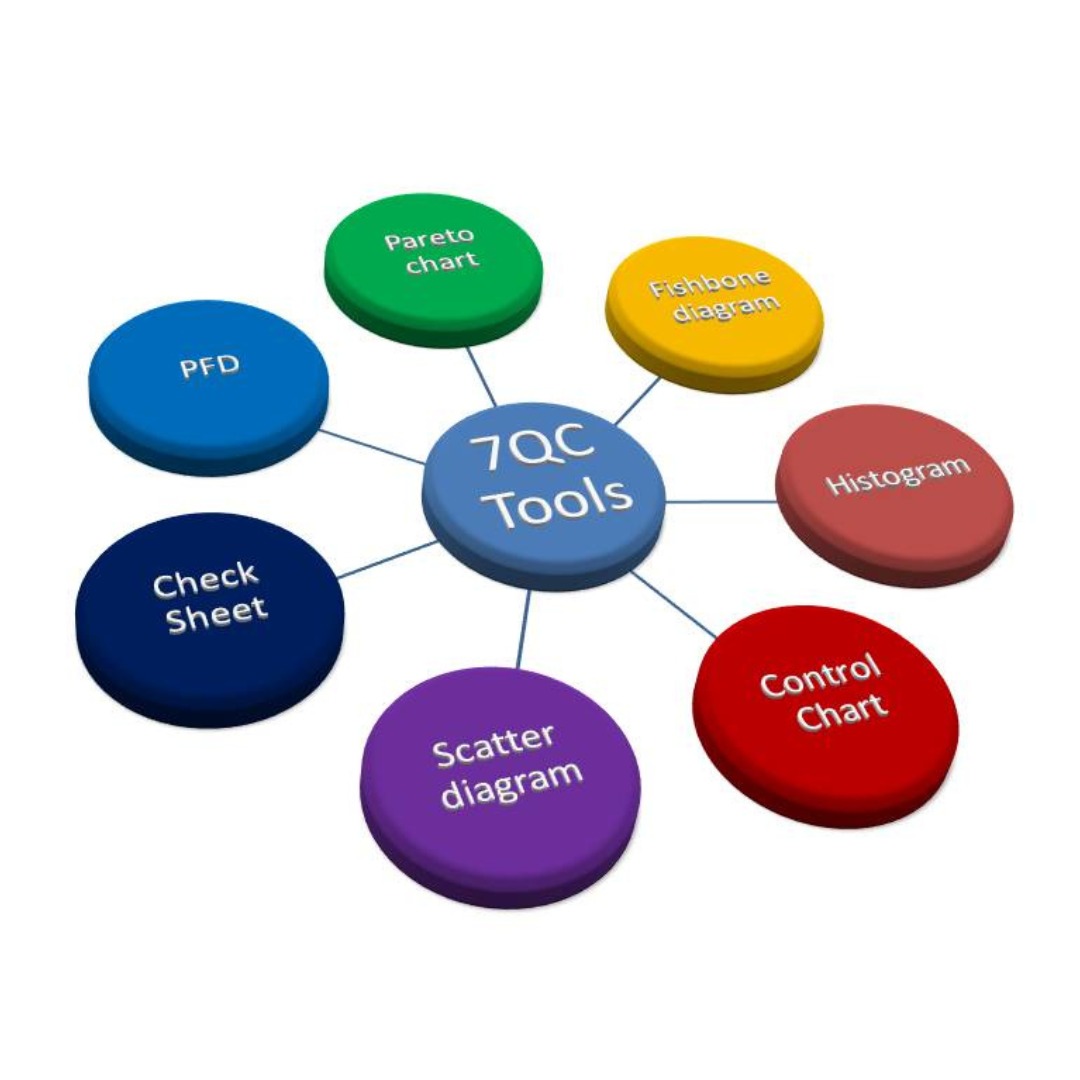
Focus on What Matters Most. We help you identify the most critical areas of improvement in your processes. By analysing data through the Pareto Principle (80/20 Rule), we uncover the most frequent issues, develop action plans to eliminate inefficiencies and prioritise resources for the greatest impact.
Identify the Root Cause. Our professionals guide you through forming Fishbone Diagrams (also known as Ishikawa Diagrams) to map out and place the root causes of problems. We cooperate closely to dig deep into possible causes and ensure nothing is missed, allowing you to address the root of any issue effectively.
Simplify Data Collection. We provide tailored check sheet designs to streamline data collection for your specific operations. These customizable tools allow you to track patterns, record frequencies, and analyse data with ease, enabling you to make informed decisions with reliable information.
Monitor and Control Variations. Keep your processes on track with real-time monitoring through Control Charts. Our specialists set up and maintain charts that track process performance, helping you detect variations and trends early, prevent defects, and sustain high-quality production levels over time.
Visualise Data Distribution. Understand your data at a glance with Histograms. We create clear visual representations of data distributions, making it easier to analyse performance metrics, spot patterns, and identify potential areas for improvement within your processes.
Explore Relationships Between Variables. Uncover correlations between different variables in your processes using Scatter Diagrams. We help you interpret complex data sets and understand how one factor affects another, enabling data-driven decisions for optimizing operations.
Map and Optimize Processes. We design clear flowcharts to help you picture every step of your process, from start to finish. This clearness gives a better understanding of workflow, allowing you to sense each stage, reduce flows, and provide smoother operations.
How is Arrowhead raising the bar as a 7QC Tools Training Consultant in Mumbai, India?

Custom Solutions for Your Industry
While the 7QC tools are everywhere, every industry has its individual challenges. We make these tools particularly for your business conditions—whether you’re in manufacturing, healthcare, logistics, or service sectors. Our team cooperates with you to execute answers that align with your goals and regulatory needs.
Training and Implementation
We don’t just supply tools; we provide your team is fully trained to use them. Our hands-on training and undertaking support ensure that your staff can integrate these quality control methods into their daily functions. From workshops to ongoing guidance, we offer the advice you need for long-term success.

Expert Guidance
Our team of seasoned professionals at Arrowhead has extensive experience in quality management and operational excellence.
Tailored Solutions
We customise every tool and strategy to fit your specific business needs and industry standards.
Proven Results
Our methods are backed by industry success and have helped countless companies improve productivity, reduce costs, and improve product quality.
Sustainable Impact
By focusing on constant progress, we ensure our services’ benefits are long-lasting and scalable as your company grows.
REQUEST A
CALL BACK
Please fill the form and click the submit button. We will get back to you in 1-2 business days.
Frequently Asked Questions
Yes, training on the 7 QC tools is generally considered more suitable for beginners compared to full Lean Six Sigma concepts, as the 7 QC tools are simpler, more basic data analysis techniques that provide a solid foundation for understanding quality improvement methodologies before diving into the more complex framework of Lean Six Sigma.
They are foundational to several process improvement methodologies, including Six Sigma and Total Quality Management (TQM). These seven basic tools of quality helps businesses to systematically categorise and analyse quality-related issues, pinpoint root causes, and implement solutions.
No, the 7 QC tools (quality control tools) are not solely relevant to manufacturing industries; they can be applied across various sectors like healthcare, finance, and service industries as well, as they are basic tools for data analysis and process improvement that can be used in any context where quality needs to be managed and improved.
Key points about the 7 QC tools:
Versatility:
Their simplicity and ease of use make them valuable for anyone involved in quality management, regardless of industry.
Data visualization:
The tools help visualize data to identify trends and root causes of problems, making them useful for analyzing processes in any field.
Wide application:
While often associated with manufacturing, these tools can be used in service industries to analyze customer feedback, identify process inefficiencies, and improve service quality.
The “7 QC tools” are considered basic, visual tools used for data collection and analysis to identify root causes of quality issues, while advanced quality management techniques involve more sophisticated statistical methods, often used for complex problem-solving and process optimization, requiring a deeper understanding of statistics and are typically used alongside the 7 QC tools in a comprehensive quality improvement approach.
These seven basic tools of quality control. They require introductory-level knowledge (most of which we learn in school such as calculating mean, standard deviation, mode, median etc) of statistics. They are easy to understand and use, compared to advanced statistical methods such as hypothesis testing, regression analysis, etc.


