How Fishbone Diagrams Help Teams Find Root Causes in Lean Six Sigma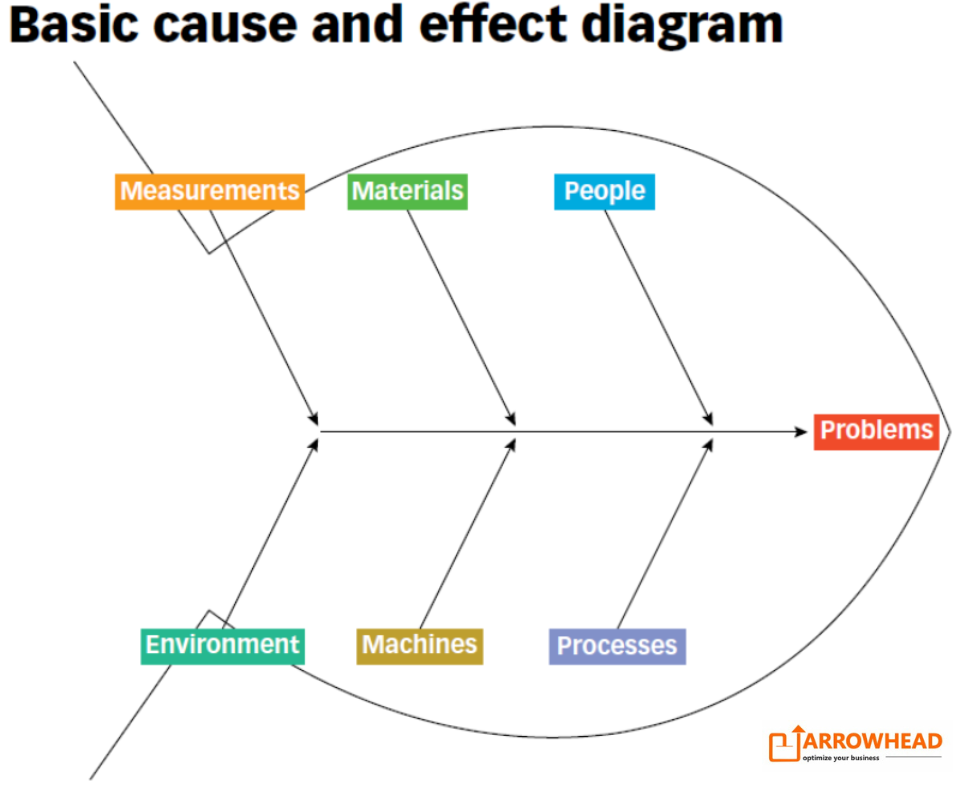
Let’s face it—solving problems isn’t easy. Often, it feels like playing whack-a-mole, fixing one issue only to have another pop-up. Enter the Fishbone Diagram, also known as the Cause-and-Effect Diagram or Ishikawa Diagram. This simple yet powerful tool can help Lean Six Sigma teams stop chasing symptoms and instead focus on identifying and fixing the real, underlying causes of problems.
Here’s how this visual problem-solving ally works and why it’s a game-changer for teams aiming for operational excellence.
What is a Fishbone Diagram?
Picture this: a fish skeleton, that’s right. The “head” is the problem you’re trying to solve; the “bones” that branch off are potential causes. Those causes are organized into broad categories such as People, Methods, Machines, Materials, Environment, and Measurements—the classic 6 Ms. It allows teams to methodically think through all factors contributing to the problem.
It Orders Chaos into Clarity
Let’s say you’re facing late deliveries in your manufacturing process. Where do you even start? The raw materials? The staff? The workflow? A Fishbone Diagram gives a clear framework, breaking potential causes into categories.
That’s an organized approach for making sure no stone or bone is left unturned. Teams easily see patterns or gaps to address the problem head-on.
Team Brainstorming Becomes a Breeze
One of the best things about the Fishbone Diagram is that it is quite collaborative. You bring together your team, and everyone throws in ideas. The machine operator might highlight recurring issues with the breakdown of equipment.
The quality control lead might flag issues with inconsistent configuration tools. The floor manager could point to a lack of standardized work procedures.
This type of group brainstorming draws in different perspectives, so you’re sure to hit all your bases. And because it’s a visual tool, the discussion stays on track and productive.
It Helps You Stay Laser-Focused on Root Causes
Here’s an error that teams make often: they address the problem at the surface level and not what’s causing it. Let’s say your team is aware of a high defect rate in the products. You might end up blaming the workers or upgrading machinery without much cause.
The Fishbone Diagram, used with the 5 Whys Methodology technique where you ask “Why?” over and over again, teams peel back the layers to get to the root cause. For example:
Why are defects occurring? Machines aren’t working.
Why aren’t they working? There’s no maintenance schedule.
Why isn’t there a schedule? It wasn’t included in the workflow design.
And suddenly, it’s clear: the real issue is a missing process-not worker error or faulty equipment.
It Reveals Hidden Relationships
Most problems are not isolated. The Fishbone Diagram will help you to identify the relationships between different categories. For example, if the problem is that deliveries are late, you may realize that improper machine maintenance (Machines) is resulting in skipped quality checks (Measurements), which further causes delays.
With these relationships, you can develop integrated solutions that focus on the root causes that lie across different areas.
It Encourages Solutions Based on Data
Once you’ve mapped out potential causes, the next step is gathering data to validate them. This eliminates guesswork and ensures your actions are based on evidence.
For example:
Is the material quality actually inconsistent?
Are workers following proper methods?
Does the equipment downtime match the delays?
Using a Fishbone Diagram alongside tools like Pareto Charts or Control Charts helps teams zero in on the most impactful causes.
It’s a Catalyst for Continuous Improvement
The insights of a Fishbone Diagram do not only fix the problem in question but open doors for long-term improvements. Once the solutions have been implemented, the diagram becomes a reference point for further discussions.
Teams can review it periodically to ensure that the fixes are working or to further refine their processes. It is not just solving problems but ensuring that it does not happen again.
A Real-Life Example: Late Deliveries
Let’s put this into perspective with a simple example.
Problem: Late deliveries.
Fishbone Categories:
- People: Inexperienced staff.
- Methods: No standardized workflow.
- Machines: Frequent breakdowns.
- Materials: Delays in raw material supply.
- Environment: Poor lighting in the warehouse.
- Measurements: No tracking of order statuses.
After brainstorming, the team identifies frequent machine breakdowns as the root cause. By implementing a preventive maintenance schedule, the organization cuts downtime significantly, leading to faster deliveries and happier customers.
It Encourages Employee Engagement
Involving employees during the creation of a Fishbone Diagram has them feel heard and valued. It is, in some ways, a way of saying, “Your input matters.” This sense of ownership fosters higher morale and commitment to implementing solutions.
Turning Problems into Opportunities
In Lean Six Sigma, the Fishbone Diagram is much more than a tool; it is a mindset. It changes the way teams face problems, shifting from symptoms to root causes. This simple diagram has the power to drive meaningful change by helping organize thoughts, foster collaboration, and promote data-driven solutions.
Whether it’s reducing defects, speeding up deliveries, or improving efficiency, the Fishbone Diagram helps teams see the big picture while honing in on the details that matter most. So, the next time you’re faced with a tough problem, grab a pen, draw a fishbone, and start uncovering the real story.


