

Beyond the Factory Floor: Why Visual Management Is the Strategic Nerve Centre of Modern Service Industries
Introduction – The New Battlefield of Speed and Information
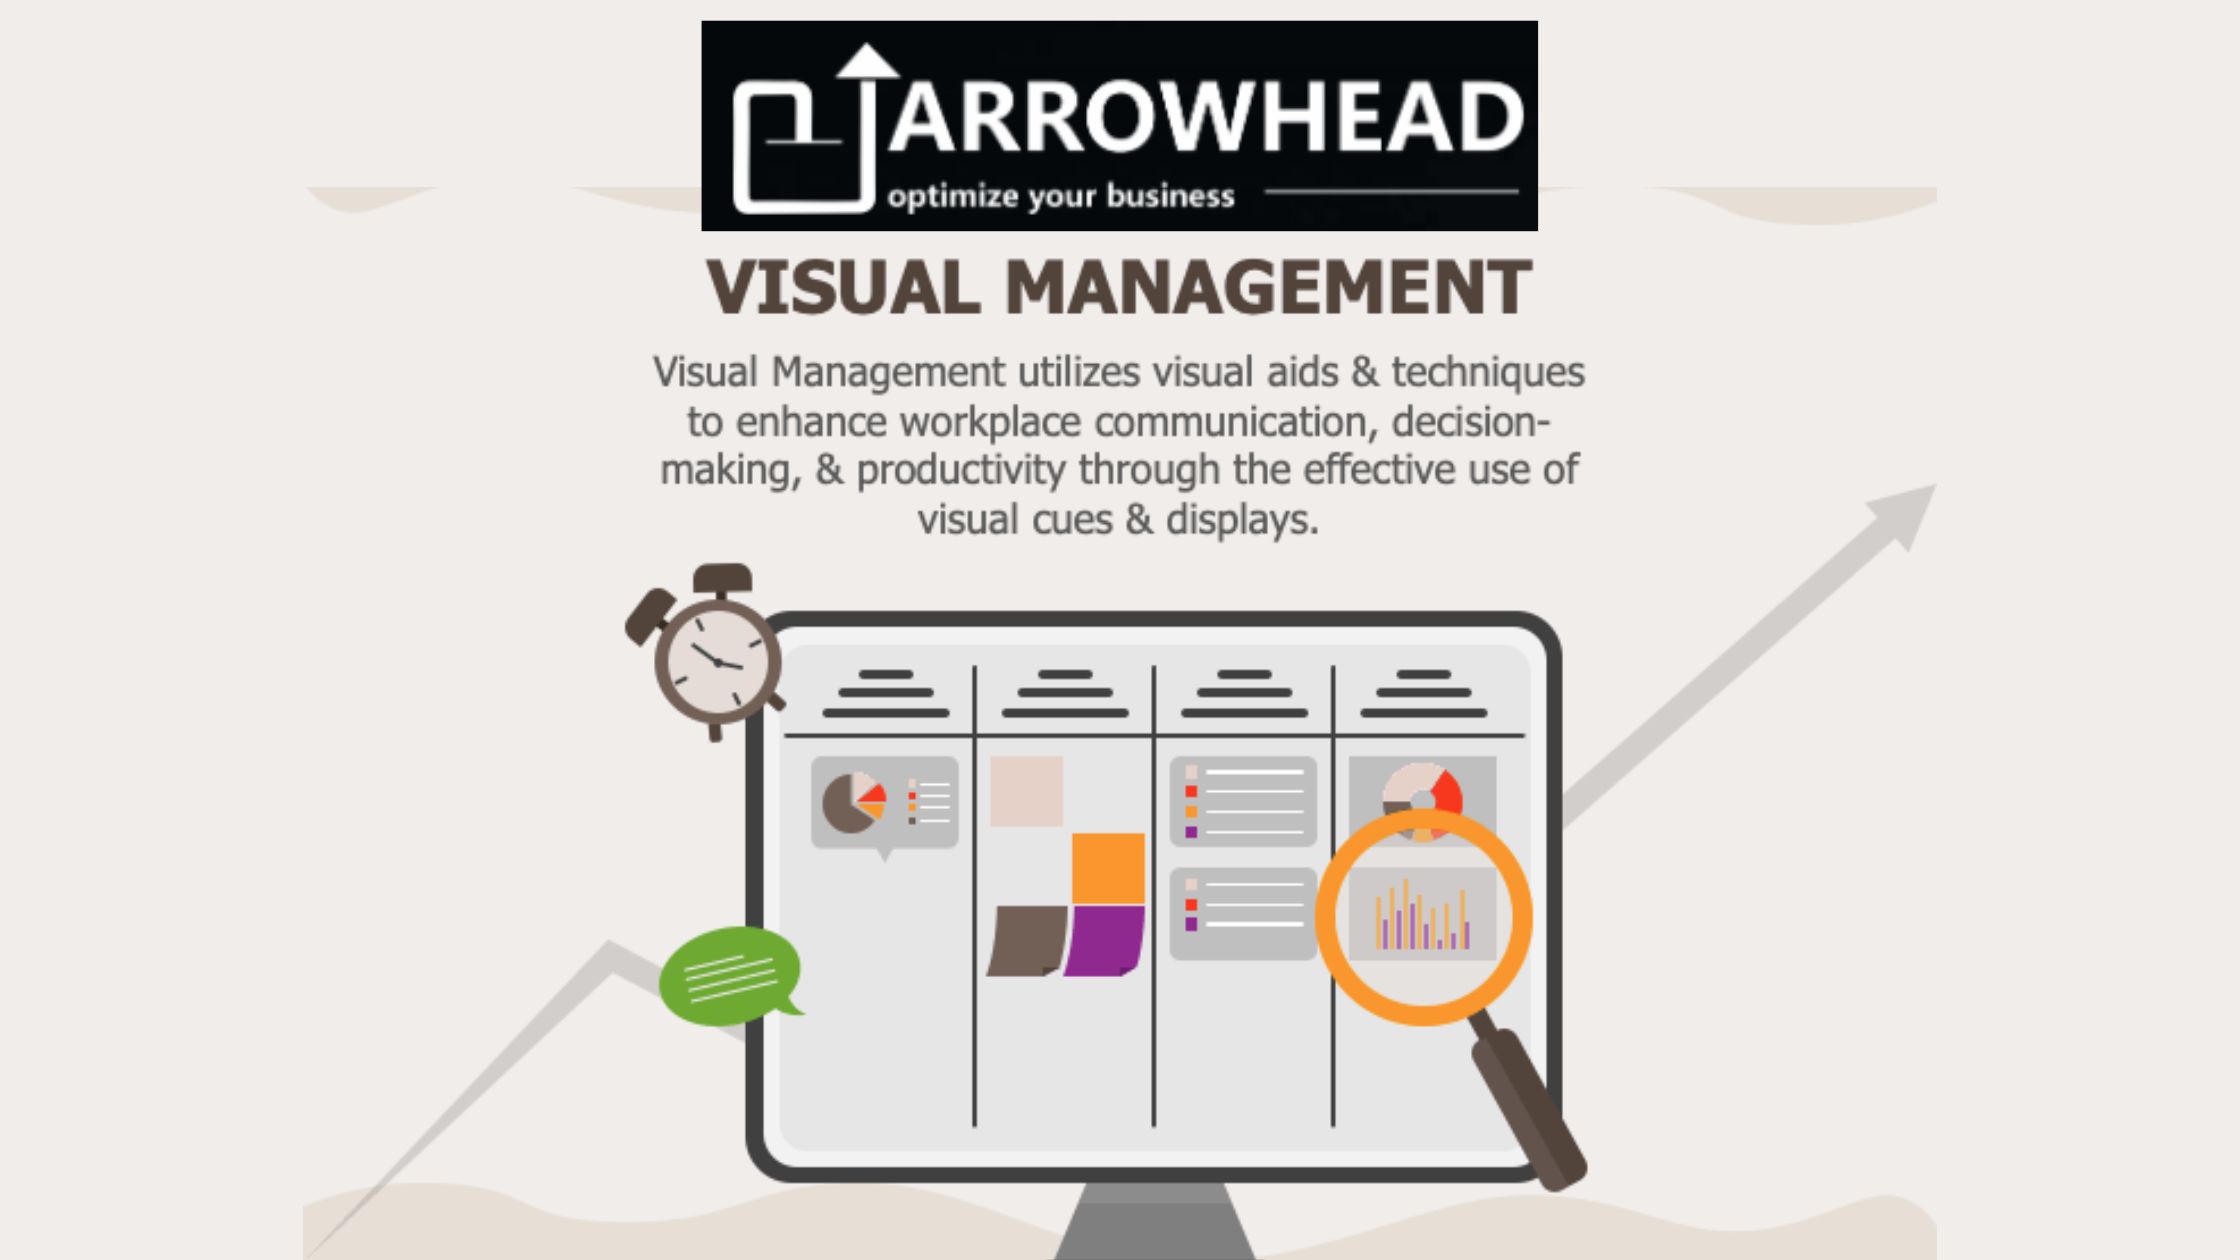
Walk into any modern service organisation — a bustling airport terminal, a stock exchange, an FMCG distribution hub, a hospital emergency unit, or an IT command centre — and you’ll notice something remarkable.
Screens.
Walls of them.
Dashboards flickering with real-time metrics.
Prediction charts.
Performance grids.
Heatmaps.
Flow boards.
Incident trackers.
Customer queues.
Delay flags.
This is the new visual workplace — the digital nerve centre of the modern service economy.
In manufacturing, visual management historically meant whiteboards, Kanbans, Andon lights, and workstations marked with tape. But in service sectors, visual management has taken on a completely different identity. Here, visibility doesn’t come from the physical movement of materials — it comes from the flow of data, decisions, and customer demand.
Today, service organisations operate in real-time. Every decision — every second — impacts customers, productivity, compliance, and profitability. Delayed visibility means delayed action. And delay is expensive.
That’s why visual management has become the strategic backbone of high-performance service enterprises — the medium through which leaders, teams, and systems stay aligned and responsive.
And this is precisely where ARROWHEAD Consulting, one of the most respected Lean consultants in India and a highly trusted Six Sigma company in Mumbai, brings deep value.
ARROWHEAD understands both worlds — the tactile nature of manufacturing and the digital complexity of services. And it knows that while visual management in a factory ensures flow of materials, visual management in the service industry ensures flow of information, clarity of decisions, and consistency of outcomes.
Why Visual Management Matters More in Service Industries than Manufacturing
Let’s establish something crucial:
Manufacturing relies on physical visibility.
Service industries rely on information visibility.
On a factory floor, you can walk around and see work happening. Machines are in front of you. The material is in front of you. Errors or delays manifest physically.
But in services?
Everything is invisible.
A delay in a software ticket.
A misrouted airline passenger.
A stock-out risk.
A compliance breach.
A credit risk spike.
A queue overload in a hospital.
A slow-moving batch in banking operations.
You can’t “walk the flow” the way Lean encourages on a factory floor.
You have to see the flow — visually.
This is why service organisations rely on:
- War rooms
- Digital command centres
- Operational dashboards
- Real-time monitoring screens
- Risk heatmaps
- Customer journey maps
- Service flow visualisation
- Predictive alerts
These tools transform intangible processes into tangible visuals.
Manufacturing visual management is about seeing materials.
Service visual management is about seeing information.
And in a world where service organisations must respond within seconds, visibility isn’t just helpful — it’s mission-critical.
The Anatomy of a Visual Workplace in a Service Industry
A visual workplace in the service sector doesn’t use tape markings on floors or Kanban cards on racks. Its components are digital, dynamic, and data-driven.
1. War Rooms and Control Towers
Rooms dedicated to decision-making, lined with data walls:
- Operations Command Centres
- Airline Control Rooms
- IT Network Monitoring Rooms
- Emergency Response Centres
- Retail Demand Control Rooms
- They house teams who monitor operations minute-by-minute.
2. Live Dashboards
These dashboards update automatically — sometimes every second.
They show:
- SLAs
- Backlogs
- Queue lengths
- Risks
- Performance KPIs
- Incident counts
- Uptime/downtime
- Service cycle times
- Inventory status
- Customer complaints
- Workforce availability
3. Predictive Heatmaps
AI-generated visuals highlighting:
- Load spikes
- Service failures
- Traffic congestion
- Volatility zones (stock exchanges)
- Airport gate delays
4. Exception Boards
Visual alerts for:
- SLA breaches
- Shift delays
- Resource gaps
- Material shortages (FMCG)
- System failures (IT)
5. Flow Visualisation
Showing customer movement or data movement:
- Passenger flow maps
- Ticket resolution timelines
- Order fulfilment flow
- Cash flow visuals
- Call centre response flows.
In service industries, this visibility is the lifeline for decision-making.
Industry-Wise Deep Dive: Where Visual Management Powers Performance
Let’s look at how different service sectors rely on visual management daily.
1. Stock Exchanges
You cannot execute trades without immediate visibility.
Visual tools include:
- Market movement charts
- Live volatility graphs
- Order book visualizers
- Derivative exposure dashboards
- Risk heatmaps
- Broker activity trackers
The entire system operates visually, and decisions happen in milliseconds.
2. Airline and Aviation
From the ATC tower to the airline operations centre, aviation runs on visual cues:
- Flight tracking screens
- Crew scheduling boards
- Gate assignment displays
- Weather visualization
- Delay risk heatmaps
- Baggage flow dashboards
Without visual management, airlines would collapse under complexity.
3. Traffic Management
Cities use:
- Congestion grids
- Traffic camera feeds
- Incident dashboards
- Signal optimisation screens
One visual command centre can manage the movement of millions of people.
4. IT & Technology
Visual management is foundational to IT operations.
Teams rely on:
- Sprint boards
- Burndown charts
- DevOps pipelines
- Incident dashboards
- System uptime monitors
- Cybersecurity heatmaps
It’s how they ensure reliability, speed, and stability.
5. FMCG & Retail
Retailers use:
- Real-time stock dashboards
- Store performance grids
- Warehouse flow displays
- Demand-supply visual boards
- Customer purchase heatmaps
- Visibility ensures shelves stay full and customers stay satisfied.
6. Healthcare
Hospitals manage complexity through visuals:
- Patient flow boards
- Emergency dashboards
- Resource availability screens
- Lab queue trackers
- Intensive care monitors
- Lives depend on visibility.
The Science Behind Visual Management – Why It Works
Visual management works for three core reasons:
1. The Brain Processes Visuals 60,000x Faster Than Text
We react, decide, and understand faster when information is visual.
2. Reduces Cognitive Load
Teams don’t have to sift through reports — the information is correct in front of them.
3. Enables Real-Time Action
You don’t “wait for data.”
You see the situation and respond instantly.
This is why ARROWHEAD Consulting — as a seasoned Six Sigma company in Mumbai — integrates visual management into every LSS deployment.
How ARROWHEAD Consulting Builds High-Performance Visual Workplaces
ARROWHEAD’s approach to visual management in service industries is built on blending:
- Lean Thinking
- Six Sigma Discipline
- AI and Analytics
- Human-Centric Design
Here’s ARROWHEAD’s proven framework:
1. Diagnose What Needs to Be Seen
- Not everything should be visual. Only what drives decisions.
2. Build the Right Visual Layers
- Operational
- Tactical
- Strategic
3. Integrate Smart Dashboards
- Predictive, automated, real-time.
4. Embed LSS Control Mechanisms
- Ensuring sustainability and accountability.
5. Design War Rooms and Command Centres
- For daily management and decision intelligence.
6. Train Teams in Visual Culture
- Visibility requires behavioural maturity.
This is where ARROWHEAD’s credibility as one of the best Lean consultants in India adds significant value.
How to Build a Good Visual Factory for the Service Sector
A “visual factory” in services isn’t physical — it’s digital, behavioural, and systemic.
Key elements include:
- Clarity over complexity
- Minimalist design
- Real-time refresh
- Color-coded logic
- Ownership tagging
- Predictive layers
- Risk visibility
- SLA visibility
- Escalation paths
A good visual factory is:
Simple enough for teams to understand,
Powerful enough for leaders to act,
Bright enough for systems to learn.
Case Studies – Where Visual Management Transformed Outcomes
IT Command Centre
ARROWHEAD helped design a real-time visual command centre that reduced downtime incidents by 36%.
Airline Operations
Visual passenger-flow dashboards led to 18% faster turnaround times.
Retail Chain
A visual stock-out prediction dashboard prevented 70% of stock-out situations.
These results are why companies trust this Six Sigma company in Mumbai with transformation.
The Future of Visual Management – AI, AR, and Predictive Visibility
Tomorrow’s visual management will be:
- Predictive, not descriptive
- Immersive, through AR headsets
- Autonomous, with AI triggering workflows
- Connected, through IoT and digital twins
ARROWHEAD Consulting is actively developing these capabilities for service-sector clients.
Conclusion – Visibility Is the New Intelligence
In today’s service industry, speed, clarity, and foresight are competitive advantages.
Visual management isn’t about screens or dashboards.
It’s about enabling intelligent decision-making, reducing uncertainty, and building operational confidence.
ARROWHEAD Consulting — as one of the leading
Lean consultants in India and a high-impact
The Six Sigma company in Mumbai helps organisations build visual systems that drive:
- Faster decisions
- Stronger alignment
- Smarter operations
- Better customer outcomes
Because when people can see the work,
They can understand the work.
And when they understand the work,
They can improve the work.
Visual management is not a tool.
It’s the language of modern operations — and the backbone of intelligent, high-performing service enterprises.